Should You Price Your Boise Area Home At The Bridge Or Just Below It?
The Short Version
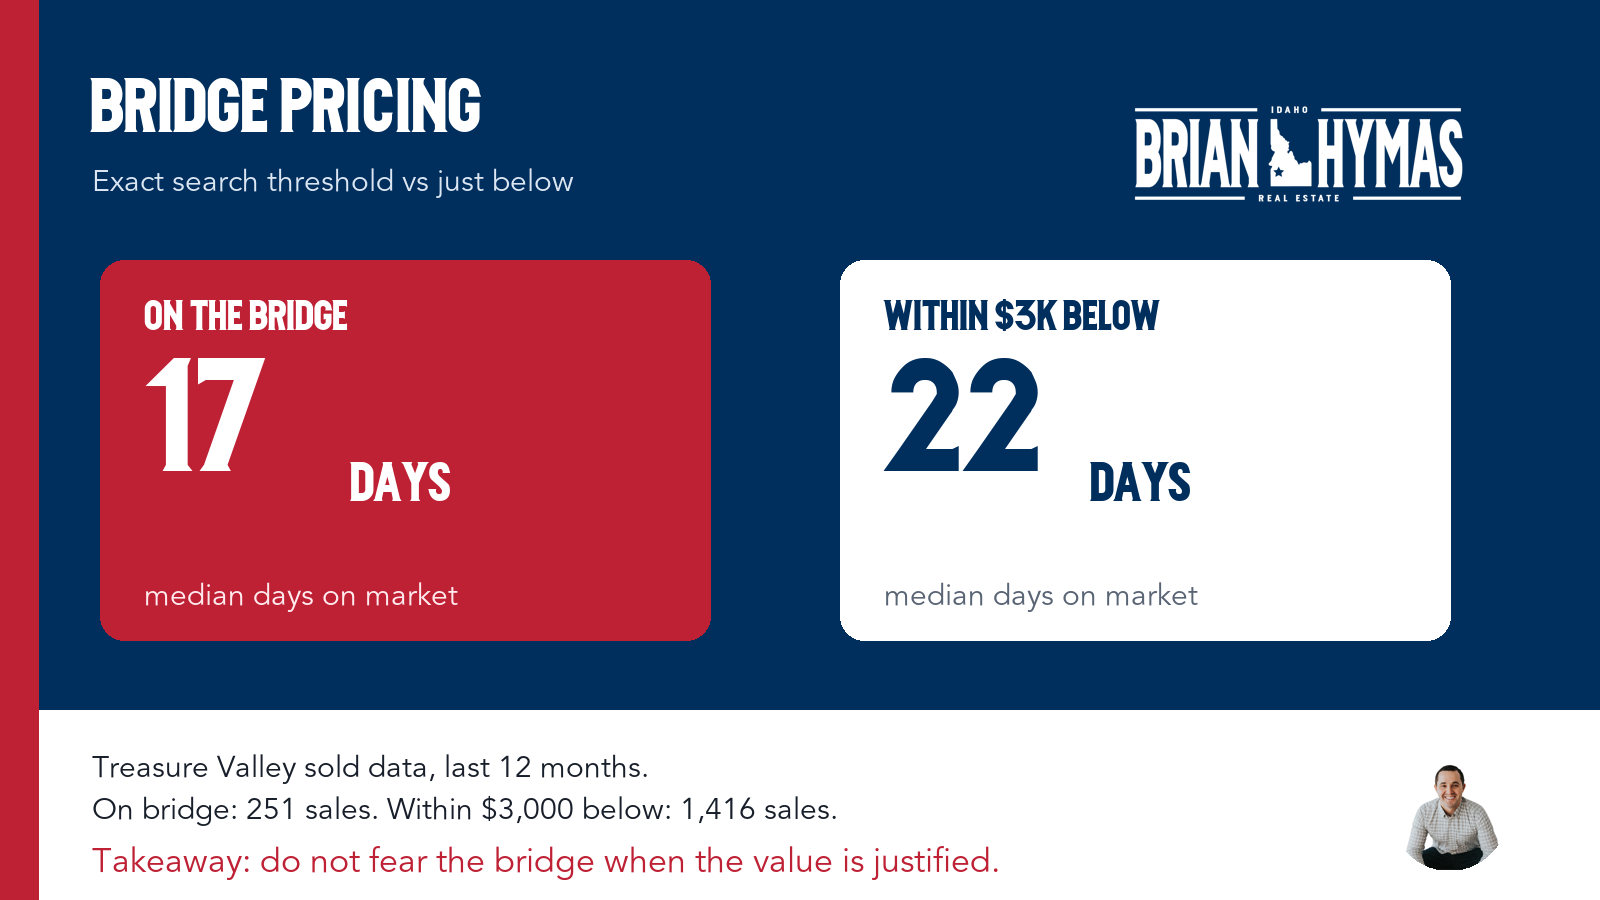
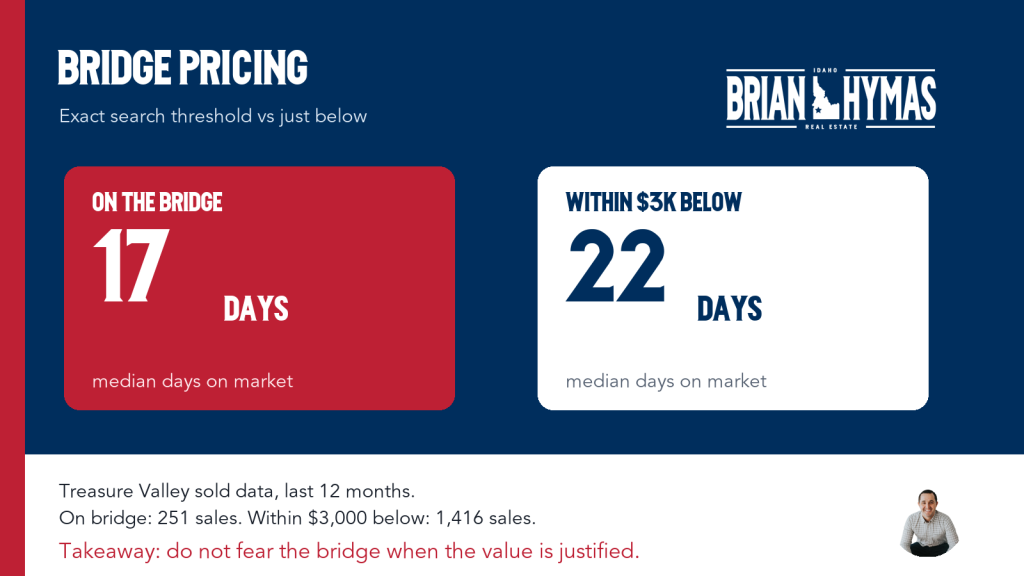
Short answer: if the home is truly worth the bridge number, pricing on the bridge can be a smart move. In the most recent Treasure Valley data I reviewed, homes priced exactly on major $100,000 bridge numbers had a 17 day median days on market. Homes priced within $3,000 below those same bridge numbers had a 22 day median days on market.
Most sellers have heard some version of this pricing advice:
Do not price at $600,000. Price at $599,000 or $599,900 so buyers feel like the home is less expensive.
That sounds logical.
But it is not always how buyers search.
In the Boise area, a lot of buyers search in clean price bands. They search up to $600,000. Or they start at $600,000. They search from $500,000 to $700,000. They save searches around round numbers.
That means a price like $600,000 is not just a psychological number. It is a bridge between buyer search ranges.
So I wanted to know what the data actually says.
I looked at aggregate Treasure Valley MLS data and compared homes priced exactly on major $100,000 bridge numbers with homes priced within $3,000 below those same bridge numbers.
The result was not what a lot of sellers would expect.
Across the most recent 12 month window, homes priced on the bridge had a median days on market of 17 days. Homes priced within $3,000 below the bridge had a median days on market of 22 days.
That does not mean every seller should automatically round up.
It does mean this: pricing on the bridge is not something to be scared of when the home is actually worth that number.
What I Mean By Bridge Pricing
Bridge pricing means pricing exactly at a major search threshold.
Examples:
- $400,000
- $500,000
- $600,000
- $700,000
- $800,000
- $900,000
- $1,000,000
The comparison group was not every home under those prices. It was tighter than that.
For each bridge, I compared homes priced exactly on the bridge with homes priced within $3,000 below it.
So for the $600,000 bridge, the comparison was $600,000 versus roughly $597,000 to $599,999.
That is the real decision a seller is usually making.
Should we price at $600,000, or should we price at $599,000 or $599,900?
The Dataset
This analysis used aggregate MLS data from the Treasure Valley.
The filters were:
- Ada County, Canyon County, and the main Treasure Valley cities
- Single family homes and single family homes with acreage
- Sold properties only
- Aggregate data only, with no individual sold property details shown
For the most recent 12 months, the dataset included 12,948 valid sold records.
For the broader time study, I used the Comp Finder database and looked back across the last 10 years.
One important note: the older historical imports have strong price data, but the days on market field is not consistently populated before 2024. So the long range price relationship is useful, but DOM conclusions are strongest in the 2024 through 2026 data. In the year by year table, I only treat DOM as meaningful where the DOM record count is large enough to trust.
The Recent Market Result
Here is the simple recent comparison.
| Pricing Group | Sales | DOM Records | Median Original Price | Median Sold Price | Median DOM | Sold At Or Above Original |
|---|---|---|---|---|---|---|
| On bridge | 251 | 225 | $600,000 | $605,500 | 17 | 48.2% |
| Within $3k below bridge | 1,416 | 1,312 | $599,524 | $580,000 | 22 | 43.0% |
The headline is simple.
Homes priced exactly on the bridge sold faster in the recent data.
The on bridge group also had a higher share of homes selling at or above original list price, 48.2% compared with 43.0% for homes within $3,000 below the bridge.
That is the important seller takeaway.
The tiny discount just below the bridge did not create a clear advantage.
Why I Am Not Leaning On 4 Year, 6 Year, And 10 Year Averages
I originally pulled 4 year, 6 year, and 10 year views too. After reviewing the table, I do not think those broad blended rows are the cleanest way to explain this.
There are two reasons.
First, the older historical imports have strong price data, but the days on market field is not consistently populated before 2024.
Second, a 10 year blended row mixes very different markets. The 2016 market, the Covid market, the 2022 shift, and the 2025 market are not the same thing.
So for the public article, the cleaner story is the most recent 12 months plus the year by year view. That gives context without pretending all years belong in one blended average.
Year By Year Results
Year by year, the market tells a more nuanced story.
During the Covid and immediate post Covid years, both groups performed very strongly. That makes sense. In 2020 and 2021, demand was so high that small pricing mechanics mattered less than supply and buyer urgency.
In 2024 and 2025, where DOM data is much stronger, the bridge strategy still held up well.
| Year | Pricing Group | Sales | DOM Records | Median Original Price | Median Sold Price | Median DOM | Sold At Or Above Original |
|---|---|---|---|---|---|---|---|
| 2016 | On bridge | 21 | 0 | $400,000 | $425,000 | Insufficient DOM data | 52.4% |
| 2016 | Within $3k below bridge | 291 | 0 | $399,900 | $407,070 | Insufficient DOM data | 35.4% |
| 2017 | On bridge | 35 | 0 | $500,000 | $500,000 | Insufficient DOM data | 51.4% |
| 2017 | Within $3k below bridge | 351 | 0 | $498,000 | $450,000 | Insufficient DOM data | 44.2% |
| 2018 | On bridge | 52 | 0 | $500,000 | $473,500 | Insufficient DOM data | 40.4% |
| 2018 | Within $3k below bridge | 543 | 0 | $498,000 | $450,000 | Insufficient DOM data | 48.1% |
| 2019 | On bridge | 54 | 0 | $500,000 | $500,000 | Insufficient DOM data | 50.0% |
| 2019 | Within $3k below bridge | 629 | 0 | $499,500 | $485,000 | Insufficient DOM data | 48.8% |
| 2020 | On bridge | 142 | 0 | $500,000 | $500,000 | Insufficient DOM data | 57.0% |
| 2020 | Within $3k below bridge | 901 | 0 | $499,800 | $498,000 | Insufficient DOM data | 63.6% |
| 2021 | On bridge | 334 | 0 | $600,000 | $600,000 | Insufficient DOM data | 67.4% |
| 2021 | Within $3k below bridge | 1,705 | 0 | $499,900 | $531,000 | Insufficient DOM data | 67.6% |
| 2022 | On bridge | 283 | 0 | $700,000 | $675,000 | Insufficient DOM data | 49.1% |
| 2022 | Within $3k below bridge | 1,379 | 1 | $599,900 | $579,900 | Insufficient DOM data | 48.6% |
| 2023 | On bridge | 177 | 2 | $600,000 | $600,000 | Insufficient DOM data | 41.2% |
| 2023 | Within $3k below bridge | 1,267 | 3 | $598,900 | $520,000 | Insufficient DOM data | 40.7% |
| 2024 | On bridge | 211 | 211 | $600,000 | $595,000 | 23 | 38.4% |
| 2024 | Within $3k below bridge | 1,203 | 1,192 | $599,000 | $555,000 | 21 | 42.7% |
| 2025 | On bridge | 260 | 259 | $600,000 | $600,000 | 15 | 45.4% |
| 2025 | Within $3k below bridge | 1,328 | 1,322 | $599,000 | $567,750 | 21 | 41.9% |
| 2026 | On bridge | 112 | 87 | $700,000 | $661,800 | 14 | 55.4% |
| 2026 | Within $3k below bridge | 634 | 535 | $599,900 | $586,450 | 19 | 50.3% |
The year by year table is useful because it keeps us honest.
Bridge pricing did not create the Covid market. It did not create the 2021 frenzy. It did not fix every overpriced listing in 2024.
But it also did not hurt sellers in the way people often assume.
The best reading is this:
When a home is priced at a number buyers already believe, the bridge can help. When a home is stretched beyond buyer perception, the bridge cannot save it.
Bridge By Bridge, Last 12 Months
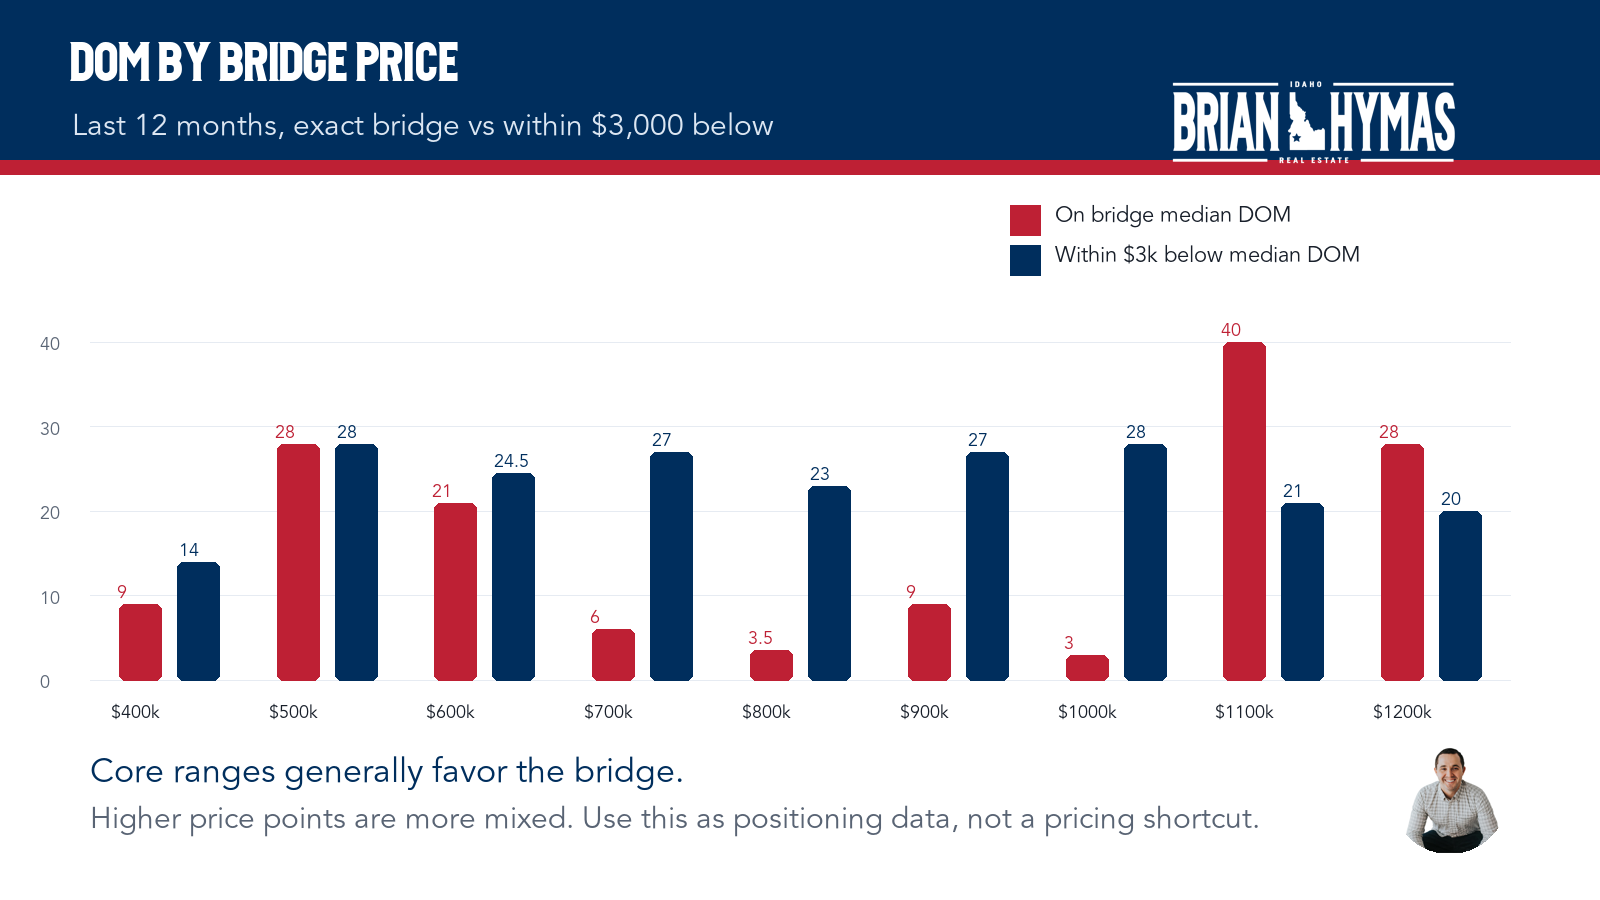
This is where the seller conversation gets practical.
Not every bridge behaves the same.
The $400,000 through $900,000 bridges showed the strongest support for pricing directly on the bridge. The luxury range is more mixed, partly because sample sizes get smaller and because higher end buyers behave differently.
| Bridge | Pricing Group | Sales | Median Original | Median Sold | Median DOM | Sold At Or Above Original |
|---|---|---|---|---|---|---|
| $400,000 | On bridge | 53 | $400,000 | $400,000 | 9 | 60.4% |
| $400,000 | Within $3,000 below | 319 | $399,900 | $399,000 | 14 | 53.9% |
| $500,000 | On bridge | 45 | $500,000 | $487,500 | 28 | 33.3% |
| $500,000 | Within $3,000 below | 307 | $499,900 | $490,000 | 28 | 41.0% |
| $600,000 | On bridge | 33 | $600,000 | $595,000 | 21 | 45.5% |
| $600,000 | Within $3,000 below | 238 | $599,900 | $589,900 | 24.5 | 39.9% |
| $700,000 | On bridge | 28 | $700,000 | $700,000 | 6 | 57.1% |
| $700,000 | Within $3,000 below | 180 | $699,900 | $690,000 | 27 | 39.4% |
| $800,000 | On bridge | 11 | $800,000 | $800,000 | 3.5 | 90.9% |
| $800,000 | Within $3,000 below | 156 | $799,884 | $790,000 | 23 | 41.7% |
| $900,000 | On bridge | 15 | $900,000 | $900,000 | 9 | 53.3% |
| $900,000 | Within $3,000 below | 92 | $899,900 | $887,650 | 27 | 37.0% |
| $1,000,000 | On bridge | 6 | $1,000,000 | $1,000,000 | 3 | 83.3% |
| $1,000,000 | Within $3,000 below | 55 | $999,750 | $990,000 | 28 | 40.0% |
| $1,100,000 | On bridge | 30 | $1,100,000 | $1,037,500 | 40 | 30.0% |
| $1,100,000 | Within $3,000 below | 41 | $1,099,000 | $1,069,990 | 21 | 29.3% |
| $1,200,000 | On bridge | 30 | $1,200,000 | $1,161,250 | 28 | 36.7% |
| $1,200,000 | Within $3,000 below | 28 | $1,199,000 | $1,176,000 | 20 | 42.9% |
The $1.1 million and $1.2 million bridges are a good reminder not to turn this into a gimmick.
At higher price points, condition, acreage, views, lifestyle features, build quality, and the right buyer pool matter more than a round number.
But in the core Treasure Valley price ranges, the data is pretty clear.
Being exactly on the bridge did not create a drag.
Why Pricing Just Below The Bridge Can Backfire
The old argument for $599,900 is emotional.
It feels cheaper than $600,000.
But buyer search behavior is not only emotional. It is also mechanical.
If a buyer searches up to $600,000, a $600,000 listing can appear. If a buyer searches from $600,000 and up, a $600,000 listing can also appear.
That is the bridge.
A $599,900 listing may feel slightly cheaper, but it can also miss the buyer who starts their search at $600,000.
In the real world, that buyer might be relocating from out of state. They may be comparing Boise, Meridian, Eagle, Star, Kuna, Nampa, and Middleton. They may not know the micro differences yet. They may set broad search bands and let the listings tell them where value exists.
If your home belongs at $600,000, pricing at $600,000 can place it directly in that decision path.
The Real Rule For Sellers
The rule is not:
Always price on the bridge.
The rule is:
If the home is worth the bridge, do not be afraid of the bridge.
There is a big difference.
If the data says a home is really a $575,000 home, pricing at $600,000 is not a strategy. It is overpricing.
If the data says a home is genuinely a $600,000 home, then dropping to $599,000 just to avoid the round number may not help. In the recent data, the homes on the bridge actually had a lower median days on market than the homes just below it.
That is the conversation sellers should be having.
Not what number feels cute.
What number puts the home in the right buyer pool and still makes sense when buyers compare it against the alternatives?
What This Means In A Listing Appointment
For a seller, this should not be presented as a trick.
It should be presented as a positioning decision.
The right question is:
Where does your home sit in the buyer pool?
If a home is one of the better options buyers will see at $600,000, the bridge can work in your favor.
If the home is weak at $600,000 and only looks decent at $575,000, the bridge is not the answer.
That is why pricing cannot be separated from condition, location, upgrades, layout, lot size, neighborhood, and current competition.
The bridge is one piece of the pricing strategy.
It is not the whole strategy.
My Takeaway
I like bridge pricing when the value is justified.
The data supports that.
In the most recent 12 months, on bridge listings had a 17 day median DOM compared with 22 days for homes listed within $3,000 below the bridge.
Across the last 4 years, on bridge listings had a 17 day median DOM compared with 21 days for homes listed within $3,000 below the bridge.
The sold to original price ratio was close enough that I would not tell a seller the just below strategy is clearly better.
For most sellers, the better advice is this:
Do not hide from the bridge if your home deserves the bridge.
Price where the buyer pool is actually searching, then make sure the home looks like one of the best options at that number.
FAQ
Thinking About Selling In The Treasure Valley?
Pricing is not just about picking a number that feels right. It is about understanding where your home sits against the current competition, how buyers are searching, and whether the price makes sense once they compare it to the other options on the market.
If you are getting ready to sell in Boise, Meridian, Eagle, Star, Nampa, Kuna, Middleton, or anywhere else in the Treasure Valley, I can help you look at the actual buyer pool around your home, the active competition, the recent sold data, and the pricing bridges that matter for your specific price range.
You can learn more about my seller process here: Brian Hymas seller process.
Or you can reach me directly at 208 891 4200 or Brian@BrianHymas.com.
What is bridge pricing in real estate?
Bridge pricing means pricing a home exactly at a major search threshold, such as $500,000, $600,000, or $700,000. These numbers matter because buyers often search in price bands.
Is it better to price at $600,000 or $599,900?
It depends on whether the home is actually worth $600,000. In the Treasure Valley data I reviewed, homes priced exactly on the $100,000 bridge numbers did not perform worse than homes priced just below the bridge. In recent data, they sold faster by median DOM.
Does pricing at a round number scare buyers away?
Not necessarily. Buyers compare value, not just digits. If the home is clearly competitive at the bridge number, the round number can help it appear in more relevant searches.
Why do some agents still recommend pricing just below the bridge?
Because the psychological pricing argument is easy to understand. A price like $599,900 feels cheaper than $600,000. But search behavior matters too. A buyer starting at $600,000 may never see the just below listing.
Should every seller price on the bridge?
No. Bridge pricing only works when the home is properly supported by the comps and current competition. If the home is not worth the bridge, the bridge becomes overpricing.
What price ranges showed the strongest bridge pricing support?
In the recent Treasure Valley data, the core ranges from $400,000 through $900,000 showed the strongest support. The higher price points were more mixed and had smaller sample sizes.
How should sellers use this data?
Use it as part of the pricing conversation, not as a shortcut. The right list price should still consider condition, location, current active competition, recent sold comps, buyer demand, and the search behavior around that price point.
Is this the right neighborhood for you?
Answer 10 quick questions and my match engine ranks 250+ Treasure Valley communities against your budget, lifestyle, and dealbreakers — real MLS data, honest tradeoffs, free.
Take the Neighborhood Match Quiz →
Takes about 2 minutes · No pressure

About the author
Brian Hymas
I've spent 35 years in the Treasure Valley — born in Boise, raised in Meridian, lived in Eagle for 8 years, now on acreage in Middleton. Before I was an agent, I was an appraiser. That means I see homes differently than most. I've closed over 120 transactions and more than $100M in sales, but the number I'm most proud of is the families who moved here from California, Washington, and beyond and said it was the best decision they ever made. There's a lot more to the story.
Thinking about a move?
Thinking about moving
to the Treasure Valley?
Start with the 2 minute Boise Match Quiz. Then book a 30 minute call to talk through your matches, budget, and next steps.
Take the 2 Minute Boise Match QuizKeep reading
More from the blog.
Selling
Selling an Acreage Property in the Treasure Valley: A Preparation Guide
Prepare to sell Treasure Valley acreage with a clear pricing discussion, useful property records and a practical seller checklist from Brian Hymas.
Read →
Selling
Should You Sell Your Out-of-State Home Before Buying in Boise, Idaho? (Honest Guide for Relocation Buyers)
Decide whether to sell your current home before buying in Boise. Compare equity, financing, timing, contingencies, temporary housing, and current Treasure Valley…
Read →